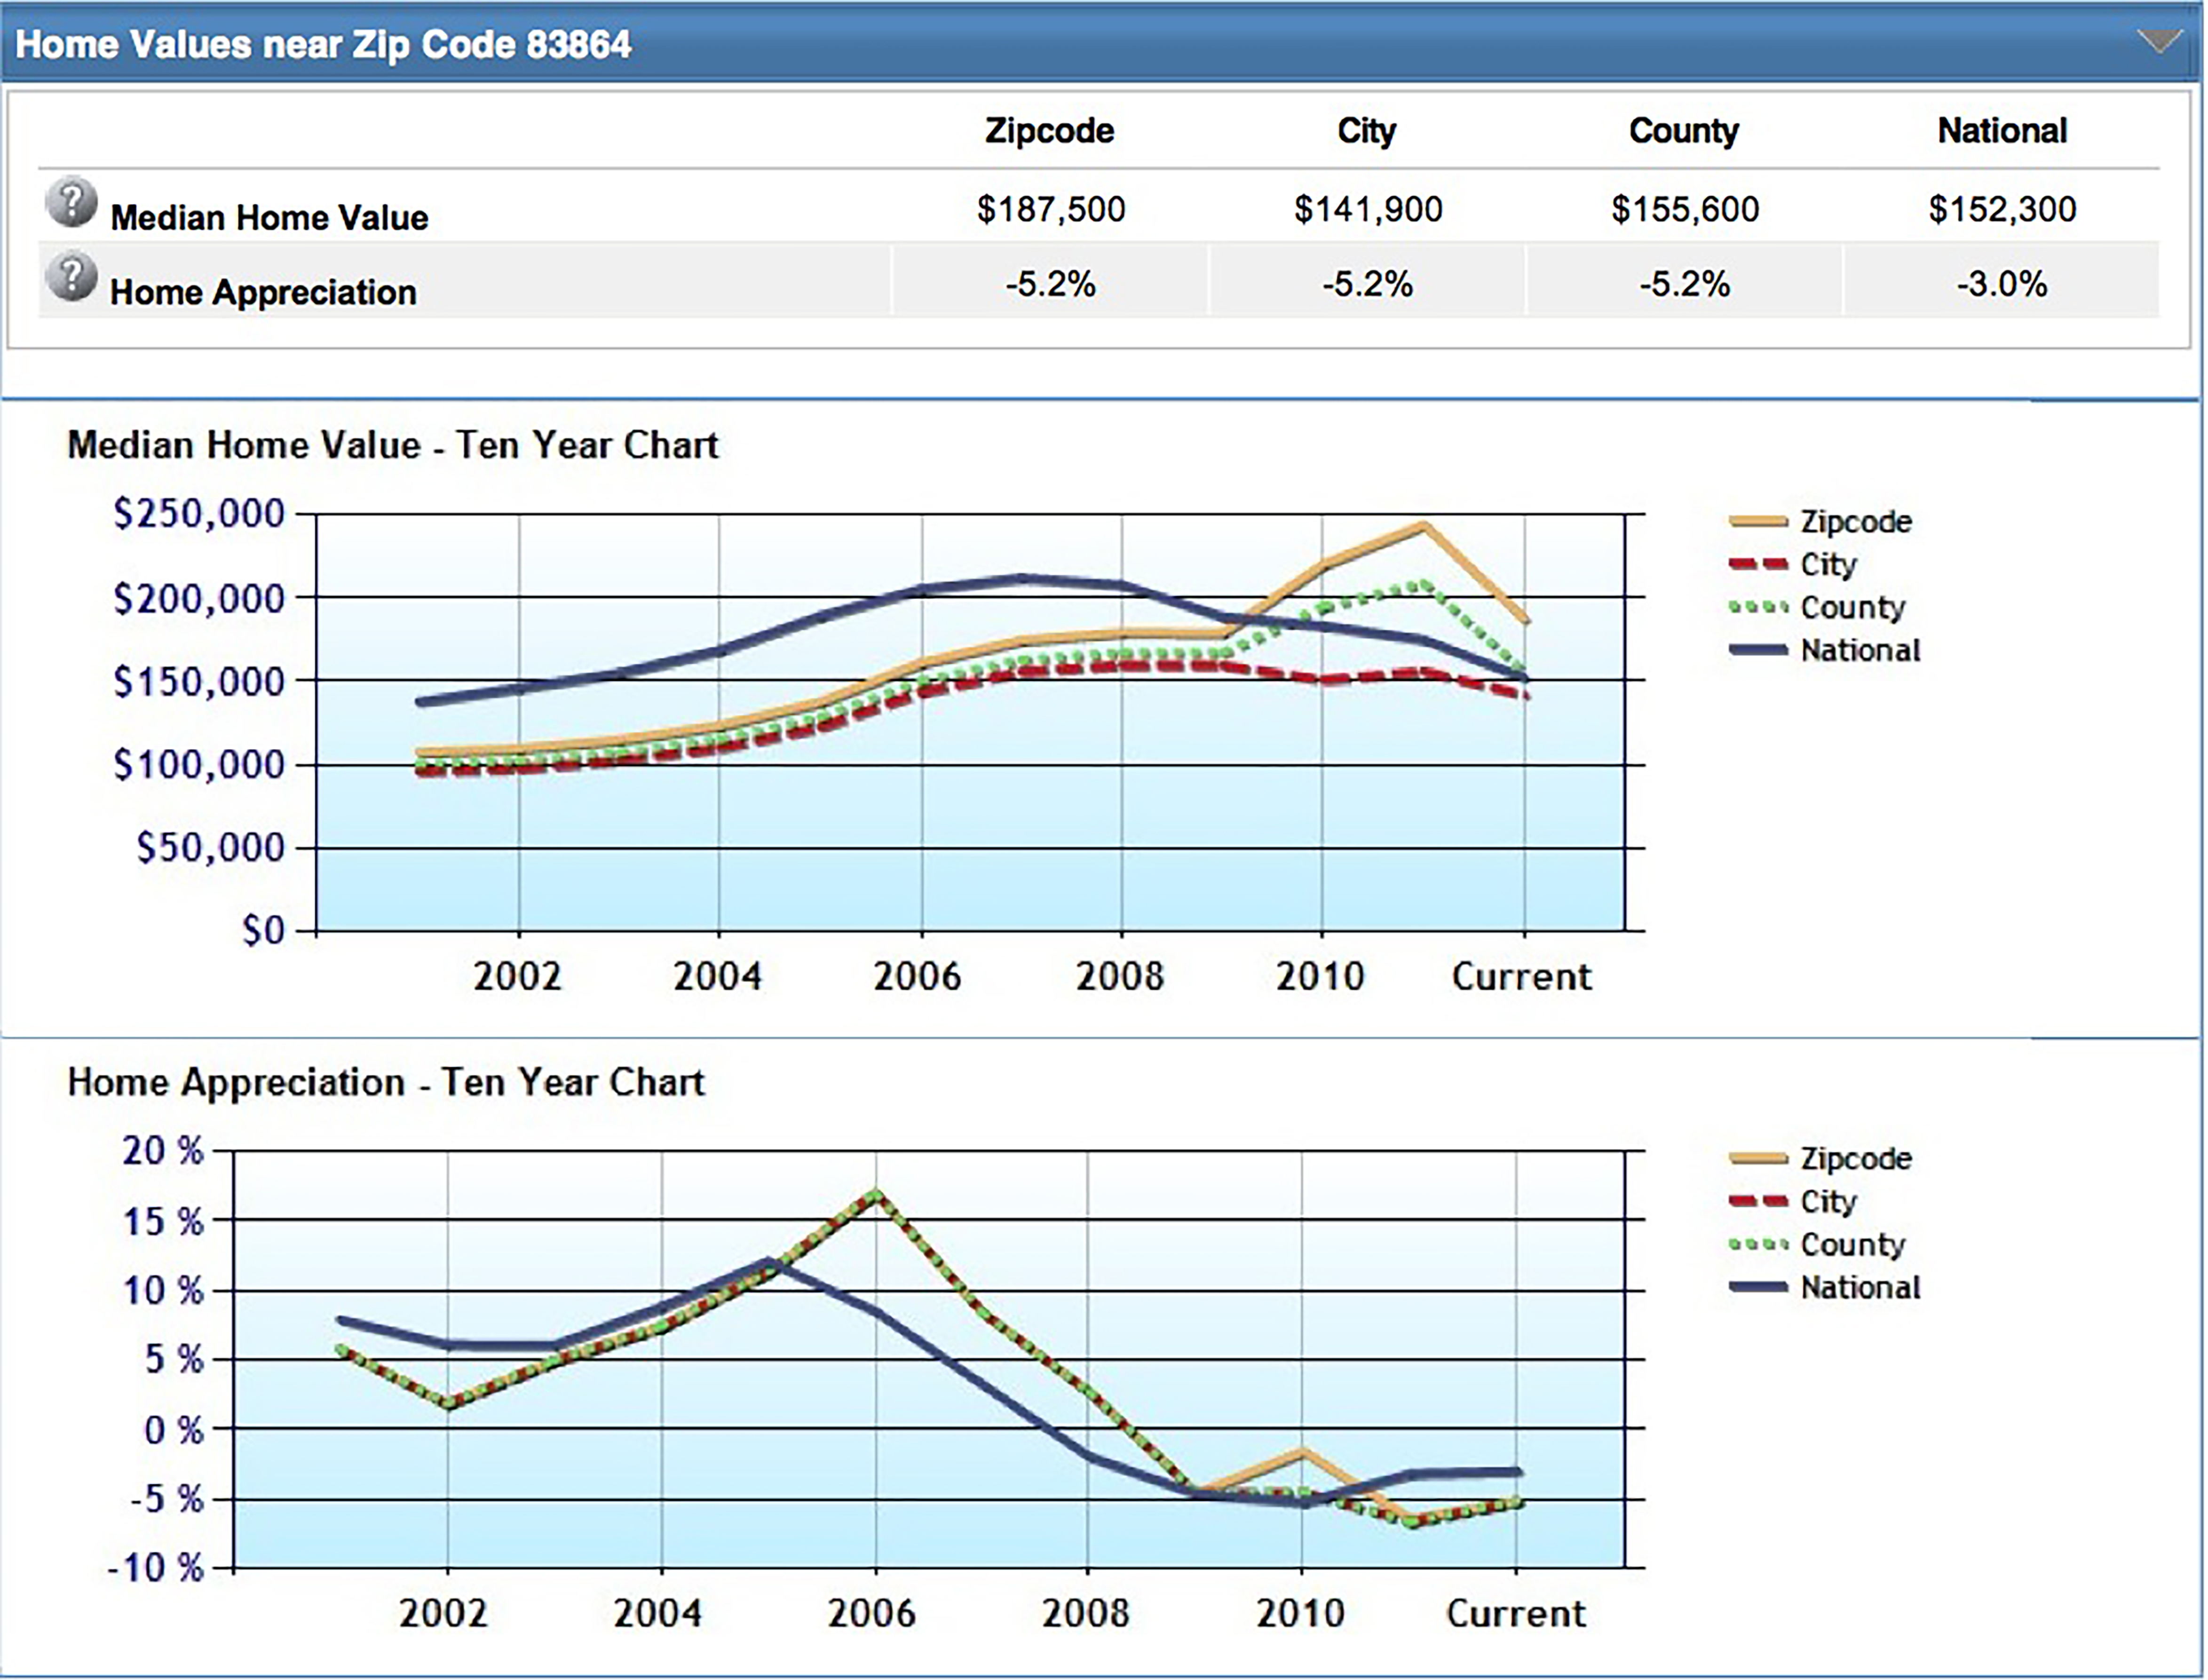
For 2022 in the Sandpoint Area for single family dwellings, the average sale price was $789,800. The average marketing time was 82 days. The sales price as a percentage of list price was 95.1%. The number of sales was 406.
For 2021 in the Sandpoint Area for single family dwellings, the average sale price was $746,700. The average marketing time was 78 days. The sales price as a percentage of list price was 99.2%. The number of sales was 592.
For 2020 in the Sandpoint Area for single family dwellings, the average sale price was $497,000. The average marketing time was 88 days. The sales price as a percentage of list price was 98.7%. The number of sales was 772.
For 2019 in the Sandpoint Area for single family dwellings, the average sale price was $443,600. The average marketing time was 111 days. The sales price as a percentage of list price was 97.8%. The number of sales was 541.
For 2018 in the Sandpoint Area for single family dwellings, the average sale price was $375,000. The average marketing time was 83 days. The sales price as a percentage of list price was 97.18%. The number of sales was 473.
For 2017 in the Sandpoint Area for single family dwellings, the average sale price was $353,300. The average marketing time was 128 days. The sales price as a percentage of list price was 97%. The number of sales was 512.
For 2016 in the Sandpoint Area for single family dwellings, the average sale price was $308,750. The average marketing time was 138 days. The sales price as a percentage of list price was 96%. The number of sales was 488.